Indicators Measuring Area's Innovative Capacity and the Ranking of Helsinki Metropolitan Area4/11/2015 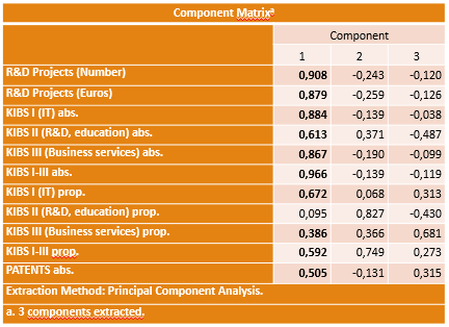 Innovative capacity of regions have often been measured by amount of patents, research & development spending and number of knowledge intensive workplaces. Inkinen & Kaakinen (2015) classified KIBS workplaces into three categories: IT, R&D and business services. They also used both, area’s absolute and relative amount of workplaces. In my PhD thesis, I have collected the most prominent indicators at zip code area level from Helsinki Metropolitan Area. All of them were kind of open data, you just had to ask from right places. R&D data is from Tekes - the Finnish Funding Agency for Innovation. I included only private sector projects in my analyses. There’s certainly a number of other R&D projects as well, but I think projects funded by Tekes indicates quite reasonably the overall amount of research and development activity. Data of patents I got from Finnish Patent and Registration Office. Data was a list of patents with the applicants address and zip code, like in the data from Tekes. GIS data of workplaces is from HSY - the Helsinki Region Environmental Services. I aggregated the point data into zip code area level, so it could be compared with other indicators as well. All the variables are from 2012, so they can be compared to human capital/creative class indicators as well. I tested which variables are most significant indicators of innovation capacity, at least what comes to this case study. Method I used was Principal Component Analysis (PCA) Analysis. Results of the PCA analysis (Table 1) shows that from collected variables, everyone but proportion of KIBS II (R&D) workplaces, indicates the same phenomena. The highest correlations are in all the KIBS workplaces together and in the number of R&D projects. Number of patents seems to indicate innovative capacity the least of significant variables. Contributing to local authorities of HMA, I made also kind of a ranking of the most innovative areas in HMA. I included all the significant variables from PCA analysis into ranking. First, I scaled every variable into index from 0-100. After that, I scaled them into one index, which I call Innovation index. The most innovative areas in HMA are listed in table 2. Maybe surprisingly, the center of the Helsinki is the second innovative area despite the first place in three of the categories. Seven of the top ten innovative areas are from Helsinki, and three from Espoo. 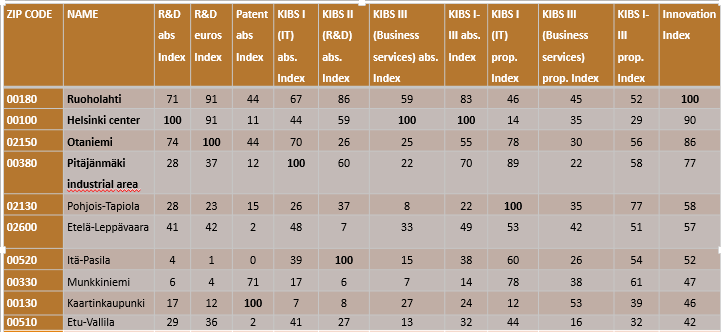
Comments
|
Photo by Rob Hurson
Categories
All
Archives
July 2018
AuthorJuho Kiuru, geographer living in Helsinki, Finland. |
 RSS Feed
