|
There are plenty of comparative studies of the innovativeness of metropolises. However, I made another one examining innovativeness in the sphere of social media. In Futura journal, I represented a comparison between the Nordic metropolises, which are usually performing well in different innovation rankings. Examining where there is the most Twitter activity related to the exact term of innovation, Swedish cities are the top performers. When examining Twitter activity proportional to city size, Stockholm is the leading innovation hub in Northern Europe with Malmö following second. What comes to themes related to innovativeness, Helsinki is the most important concentration of startups and technology in the Nordic countries. Stockholm and Malmö are the second and the third largest concentrations of both, startups and technology. Related to innovativeness and economic growth, also the tolerance of the citizens was considered. Interestingly, perhaps the most famous city in the Nordics facing problems related to immigration, Malmö is welcoming refugees most generously. In fact, Malmö is the only metropolitan area, where there is significant movement related to hashtag #refugeeswelcome. Different themes related to innovativeness combined, the same cities appear high in ranking. Overall, Stockholm (in the picture below) is the most innovative metropolis in the Nordic countries. Helsinki has the second most Twitter activity related to innovativeness and Malmö the third most. From the results, it is obvious that metropolitan areas should be compared to metropolises approximately the same size - even if measured proportional to city size. The capitals and the largest metropolises of the Nordic countries are competing with each other, while the secondary cities of Nordics are competing in their own race (empirics of them later on). 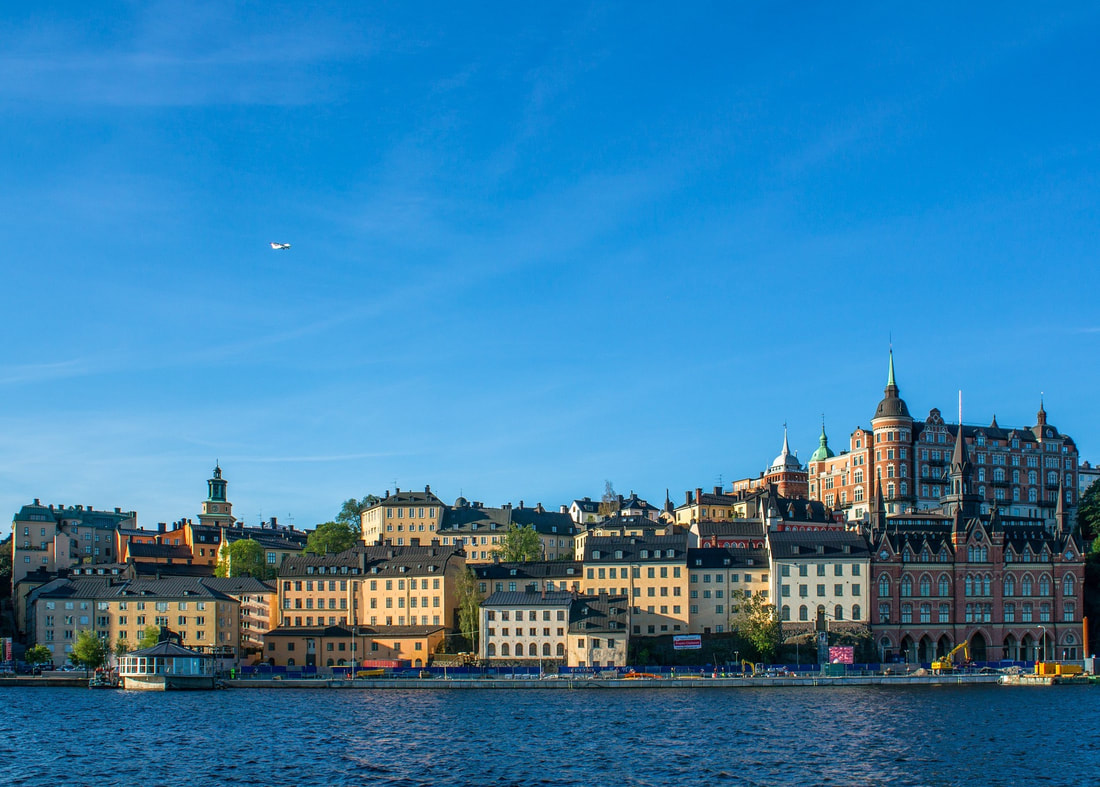
Comments
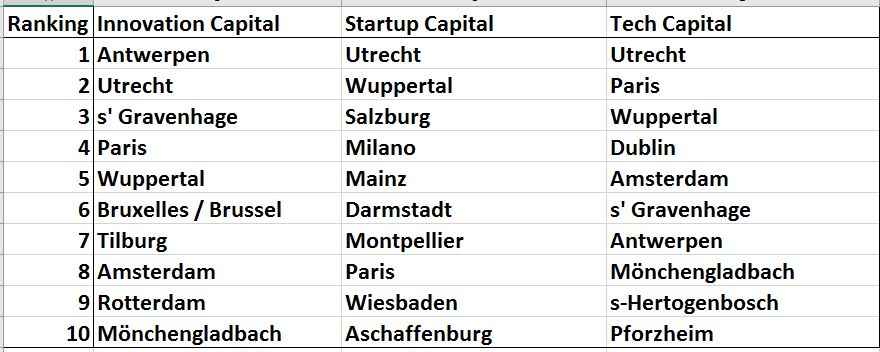
Antwerp is the Innovation Capital of Europe, Utrecht both the Startup Capital and the Tech Capital14/10/2016 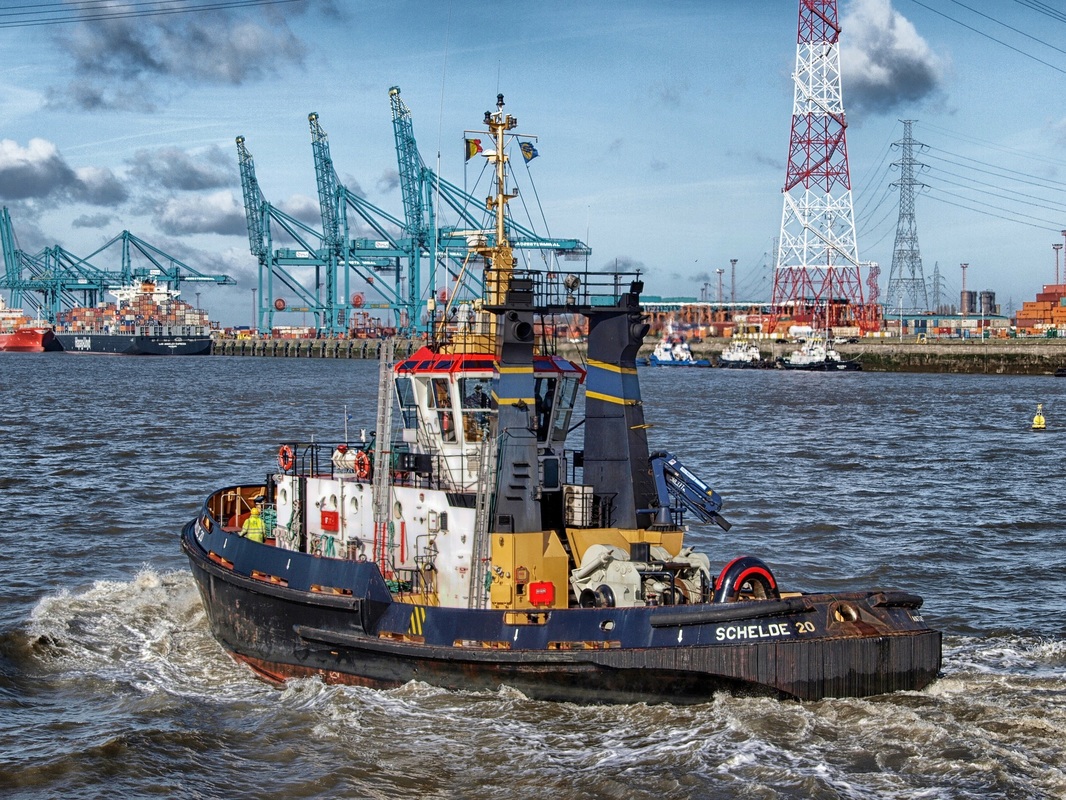 Everybody likes rankings. So I ranked European metropolises using twitter data I blogged about last time. I ranked cities regarding to Twitter activity related to innovations, start ups and tech. It seems like the innovation capital of Europe is Antwerp followed by Utrecht, which in turn is both the start up capital and the tech capital of Europe. Top tens consist of cities from Netherlands, Belgium, Germany, France, Italy and Austria. All from the core areas of Europe or from the so called Blue Banana, or near it. This is despite the fact that the rankings were made of relative amount of tweets per inhabitants. This is another finding suggesting agglomeration economies benefit the most urbanized areas. In addition to innovation ranking, start up ranking and tech ranking, I will include whole data set which contains absolute number of tweets as well as tweets per 1000 inhabitants of every European metropolitan area. Feel free to do your own rankings or analyses of the data!
  Mining spatial data from Twitter is rather easy. You need just to download open source R software and geoffjentry's TwitteR package from github. I haven't even used R before, but this manual from Julian Hillebrand is fantastic and helps you to get started really easy. After preparations, all you need is following code to mine tweets containing certain hashtag from certain location. To construct the code, help from peer R users was got from R-help site and from R-help mailing list. This is really the coolest feature in the whole open data scene. Everyone are willing to help and share their knowledge and information for nothing. Motivated from this culture, I will publish the data I mined in the next blog post (I have it on another computer). Feel free to use if you are interested in Twitter activity in European Metropolitan Areas. Here is the code if You wan't to use different areas or different hashtags. searchTwitter('innovation', n=30000, geocode='48.8566,2.3509,30mi') where n=expected amount of tweets from last two weeks. The smaller the number, the faster the software mines the data. Therefore, for smaller metropolises I used n=1000 and if command brought me 1000 tweets, I raised the amount. With the largest metropolises, it was necessary to use n=30000. Geocode is latitude and longitude of the location where the tweets are mined from. Coordinates have to be in four-digit form. Coordinates I got one by one from website Find latitude and longitude. After the coordinates, the radius where the tweets are mined can be defined. Radius must be in miles. I thought 30 miles’ radius would be average size of metropolitan areas. By changing the parameters to code, I mined the list of tweets city by city. I will upload the database soon.
|
Photo by Rob Hurson
Categories
All
Archives
July 2018
AuthorJuho Kiuru, geographer living in Helsinki, Finland. |
||
 RSS Feed
