 In my old office, someone who had sat there before, had printed a paper with that heading, "Causation or correlation"? and hanged it on the wall. Little did I know, that this phrase would haunt me couple years later like that pumpkin from Shit academics say's meme from last Halloween.
Well, today I found out that I could not say that e-capital creates economic development from the results of my analyses. Opposite, from my results, can be concluded that e-capital clusters in more developed regions. It makes sense now. Luckily, this is only minor revision at this point. Last review round forced us to re-write the whole paper. After all, I am thankful to the referees, who have put so much effort reviewing our text. Comments have made our text so much better. Now I am going to be much more comfortable defending my thesis one day, a day so much closer again. :)
Comments
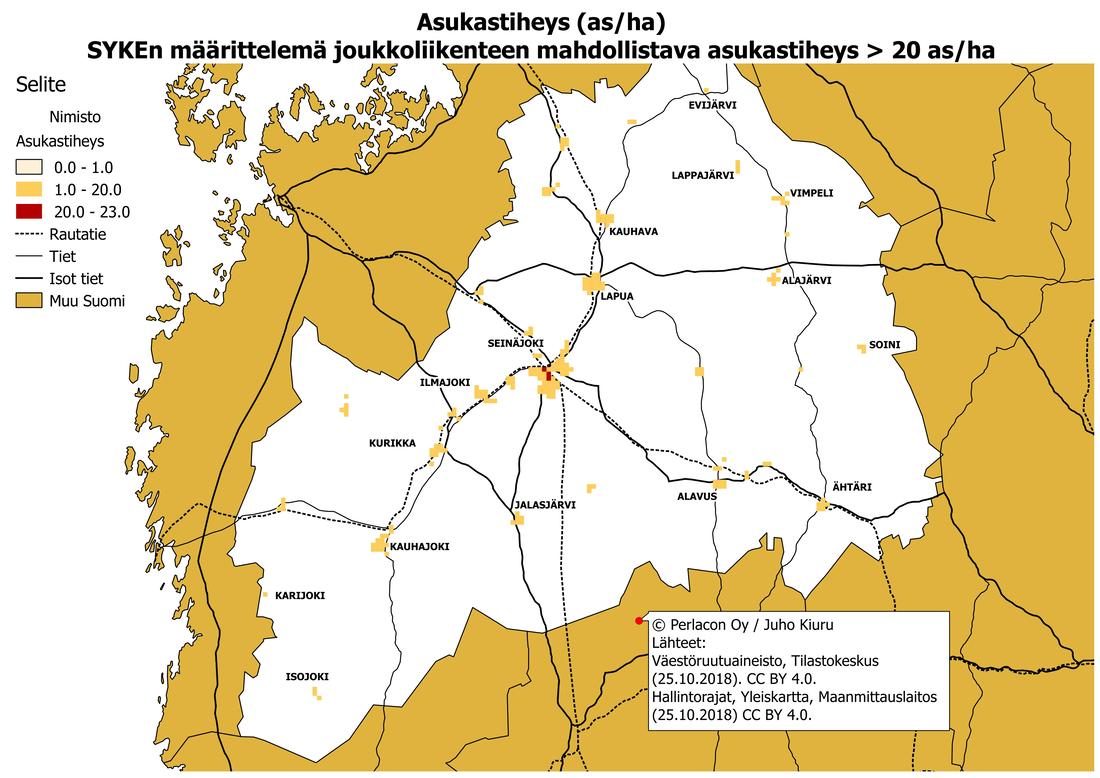 Finnish Environment Institute has defined population density, which allows cost efficient public transport. It is 20 inhabitants per hectare. In the most populated parts of Finland (figure below), nearly half of The Helsinki Metropolitan Area is dense enough. However, there is still work to do. For example the corridor of future underground extension will need some infill development if wanted to pay off. In some other parts of Finland, regions face different kind of challenges. Albeit city of Seinäjoki is growing fast, in an entire state of Southern Ostrobothnia (figure above), there are only four 250m x 250m squares that are dense enough for cost efficient public transport. By the way, the figure above is part of a first commision of my newly founded firm, Urban Analytics Helsinki. It was made with an open source software (QGis) as well as of open data (Statistics Finland, National Land Survey of Finland). The figure below is made just for the fun of it. :) 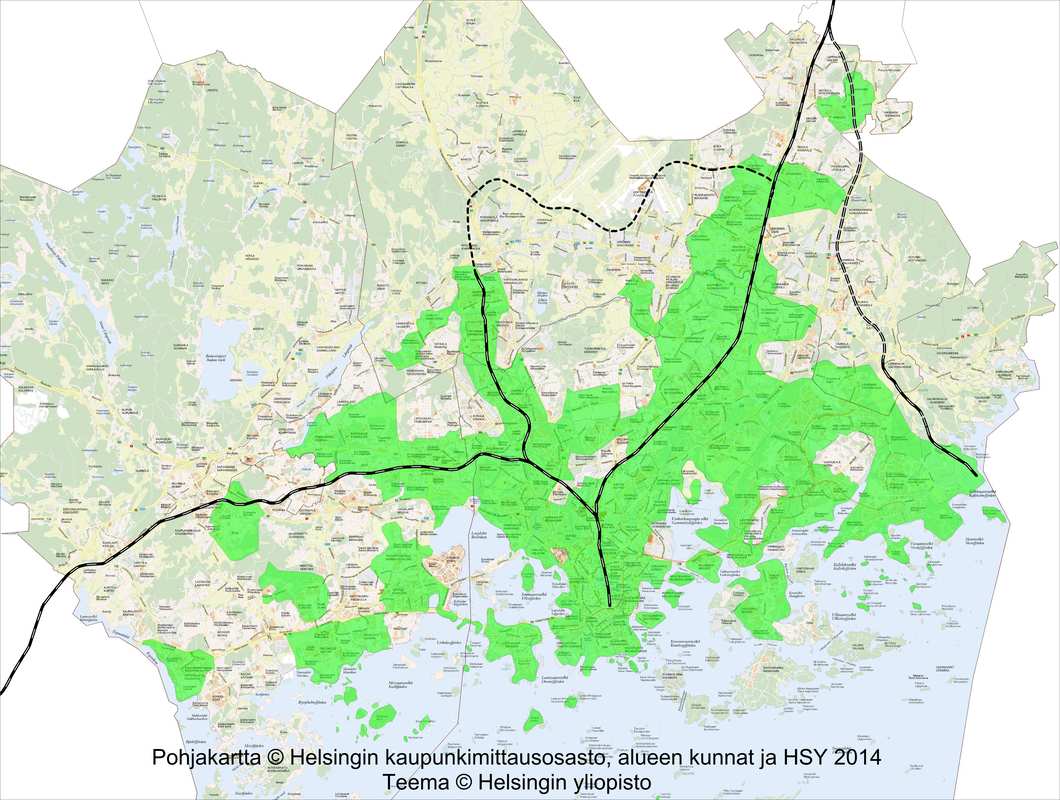 The creativity of people have been measured in human capital studies most commonly with tertiary degrees. However, some argue that creative people like Bill Gates or Steven Jobs wouldn't count in this kind of approach. They say creative occupations indicate the best regional development. I believe something lacks from the narrowing to professionals. First of all, entrepreneurs may miss from occupation classifications. Second, some may have an occupation not considered creative, but can be highly creative in free time. Third, not only persons are creative. Also organizations, firms and the likes may be as creative. All this considered, I believe creativity correlated to regional development can be found best in social media. We did some regression analyses with the traditional occupation indicators. We compared how well analyzing Twitter activity related to creativity added value to the analysis. Compared to 34,1 % explanation power of creative occupations, even 59,1 % of GDP per capita could be explained with Twitter activity related to creativity. When predicting regional development with both, occupational indicators as well as Twitter indicators, the explanation raised even 73,2 %. From these figures, it is evident that creativity is related to innovative economic growth. Also potential growth is predicted in third article of my PhD thesis, which is currently almost in the half way. Already now it could be said that examining creativity in social media is more fruitful predicting innovative growth than former methods of analysing the level of education or occupational divisions.  |
Photo by Rob Hurson
Categories
All
Archives
July 2018
AuthorJuho Kiuru, geographer living in Helsinki, Finland. |

 RSS Feed
